← All projects

Football Stats Algorithms

Statistics algorithms and data crunching for my two fantasy football leagues, built as live Google Sheets: a regression-based value line and price model for the auction, and a multi-season player model for a keeper draft. Maths and spreadsheet engineering I couldn't have built myself, steered by eleven years of playing the league.

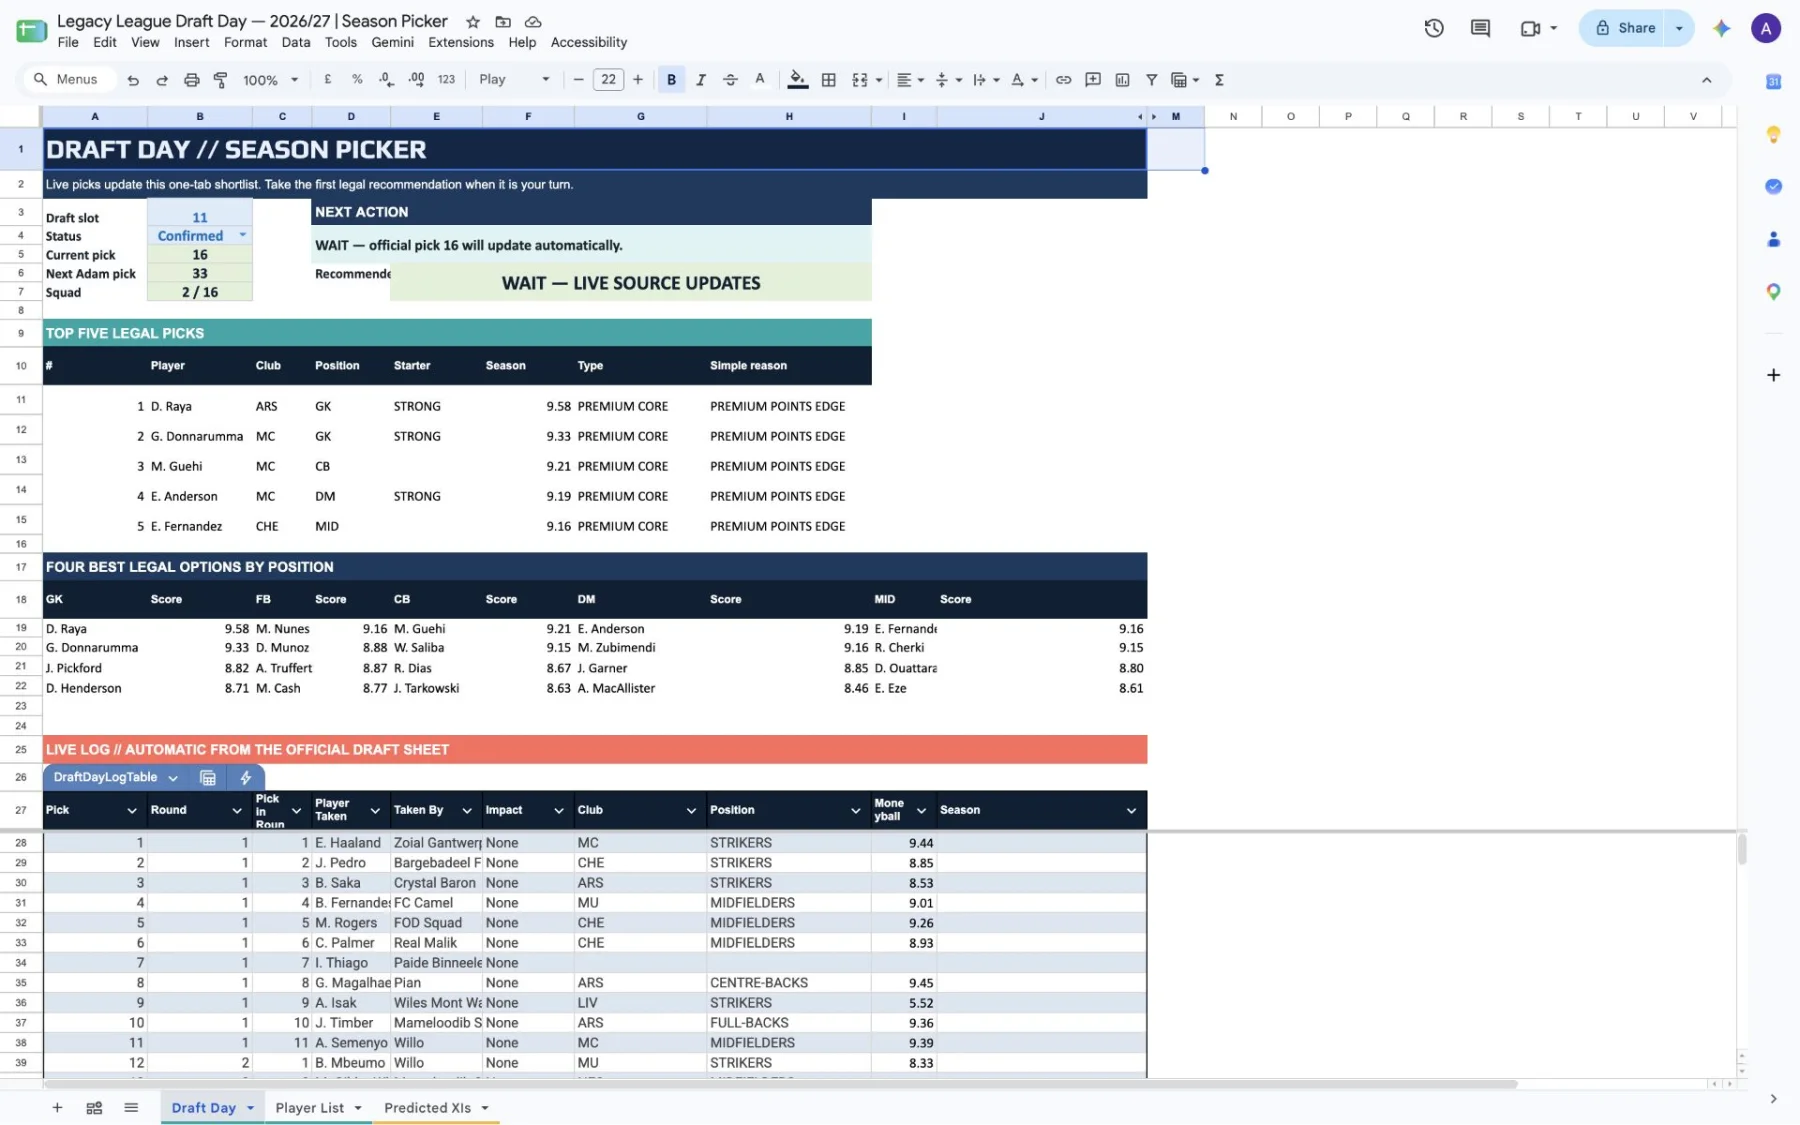
Legacy League Draft Day sheet showing the next action, the top five legal picks, the best options by position and a live log of the official draft
Draft Day, mid-draft · Google Sheets

The short version

historical auction lots modelled
1,570
average price error, down from £4.50m
£3.11m
of real prices inside the forecast range
96%
players scored in each sheet
484

What it is

These are the most purely analytical things I've built. One sheet runs my auction league: 19 managers, each with the same budget, bidding for a squad of 13. The other runs a keeper league with a snake draft, where you hold players for years. Both are native Google Sheets I used live on the day.

The point was never to replace judgement. Each sheet states the bet: what a price demands in points, what the player is likely to do with an honest range, and how often paying that much has worked before.

What I had to steer

My steer was the domain knowledge. The first model contradicted eleven years of playing the league: none of the top 50 scorers came out as a buy, and ten players from newly promoted clubs did. I pushed back, and we separated how good a player is from what he's worth at a price, made the official league points the anchor and treated the squad efficiency target as a squad target, not a hurdle for every player.

I also kept my own price guesses as a separate column. The model was never allowed to train on them or overwrite them.

What I wired together

Python scripts pull the official Fantasy League player export and Premier League stats for three seasons, then build each workbook and publish it to a native Google Sheet with release checks and a backup before every change. The auction model uses regression to the mean with per-position shrinkage, a ridge regression for room prices with a rolling backtest, and a holdout season it never trains on.

Where I pushed it

Honest numbers. Last season's points only explain about 21% of next season's, so every projection carries a range. After the auction I imported all 247 real purchases, measured the old price forecast at £4.50m average error, built a new one, and only accepted it once it came in at £3.11m on a season it hadn't seen.

The build log

The auction cockpit

My auction league has 19 managers, each with the same budget to build a squad of 13. The hard part isn’t knowing who’s good. It’s knowing when a price has stopped making sense.

The method

The sheet answers three separate questions, on purpose.

  • What is he worth? A projection that regresses last season towards the mean, because last season is a noisy guide. Across 263 players with two seasons of exact points, the correlation is 0.46. Each position gets its own fit, shrunk towards the overall fit when the sample is small, so a handful of goalkeepers can’t swing the result. A backup’s projection is scaled down by the minutes he actually played.
  • What would I pay? The value line is that projection divided by 3.3 points per million, the pace my best seasons ran at. A conviction ceiling sits above it for the one or two players I’m genuinely sure of.
  • What will the room pay? A separate price forecast, trained on 1,570 historical auction lots, gives a range rather than a number.

Where I steered it

The first version was mathematically tidy and obviously wrong. It said none of the top 50 scorers were worth buying and ten players from newly promoted clubs were. It was comparing a cautious projection with a price built from an uncautious one, and it counted a season of placeholder zeros as real results.

I knew from eleven years in the league that proven scorers are worth paying for. So the model changed shape: player quality (Core, Value, Watch, Punt, Avoid) became its own judgement, separate from price. Proven scorers got a floor so the regression couldn’t erase them. The 3.3 target went back to being a squad target. Promoted players start as punts, whatever their price looks like.

Checking it against reality

After the auction I imported every purchase: 247 players, 19 squads, £1,851.5m spent, all reconciled to the locked teams. The old price forecast was out by £4.50m on average, and only 31% of real prices fell inside its range.

The replacement is a ridge regression with points thresholds, position effects and older seasons weighted down. On the 2026/27 auction, which it never saw during training, the average error is £3.11m and 96% of real prices land inside the range. The range is deliberately wide. My own guesses stay as a separate column.

No files are shared here, only the method. The sheet itself has my league’s data in it.

The keeper draft

Legacy League is a different problem. It’s an 11-team snake draft, and you keep the players you draft. A 22-year-old who scores a bit less this season can be worth more than a 31-year-old who scores more. I picked 11th, so I’d get 16 picks and long waits between them.

The method

Every player in the official list of 484 gets scored from three completed Premier League seasons, weighted 50%, 30% and 20% towards the most recent, and translated through this league’s scoring rules. A season only counts as proven above 900 minutes.

Two scores sit on top of that. Season Score is about this year: 70% current form, 20% exact league points from the last two seasons and 10% long-term value, with penalties for players who might not start. Legacy Score is about the years after: proven output, how long you’d control the player, role, scarcity in each position, team and confidence in the data, minus a risk penalty.

Age was the part I cared most about getting right. An early version gave every outfield player 25 or under a perfect longevity score, so a teenager with no output looked like a keeper. The replacement declines every year, more slowly for goalkeepers and centre-backs, and it multiplies proven output instead of adding to it. Age can protect a good score, but it can’t create one.

On the day

The Draft Day tab read the official draft as it happened. It showed the next action, the five best legal picks, the four best options in each position and how many picks until my turn. My shortlist ticked through automatically as players went. A Predicted XIs tab gave a starter signal for all 20 clubs, which nudged the score down for players who might not start.

It’s 23 sheets in total, but only four are meant for humans. The rest are the working, so every number can be traced.